Analyzing ZFS performance
Table of Contents
A look at write performance with & without compression.
Context #
This is NOT an all-in post about ZFS performance. I built a FreeBSD+ZFS file server recently at work to serve as an offsite backup server. I wanted to run a few synthetic workloads on it and look at how it fares from performance perspective. Mostly for curiosity and learning purposes.
Performance #
As stated in the notes about building this server, performance was not one of the priorities, as this server will never face our active workload. What I care about from this server is its ability to work with rsync and keep the data synchronised with our primary storage server. With that context, I ran a few write tests to see how good our solution is and what to expect from it in terms of performance.
When it comes to storage performance, there are two important metrics that stand above all. Throughput and Latency. In simple words, throughput, measured in MiB/s is the maximum amount of data the system can transfer in/out per time. Latency or response time, measured in microseconds or milliseconds is the amount of time taken for an io to complete.
Methodology #
Coming from a storage performance engineering background, here is how I approach performance benchmarking.
The goal of benchmarking is to simulate as realistically as possible the workflow that the system is going to support, measure the performance of the system and its subsystems, identify bottlenecks, tune subsystems one by one, effectively removing all bottlenecks until desired performance goals are achieved or reaching a state where a bottleneck cannot be removed without physcical change to the system.
All that said, I dont intend to spend my time removing all bottlenecks in our ZFS system and make it the fastest ever!. My goal for this post is only on the measure phase of the cycle. Lets get started.
What attributes do I care about?
- Sequential write - to see how good the server will handle the data coming in from our primary server through rsync.
- Sequential read - for when I need to restore files from this server to the primary(less important).
I dont care about random read/write, unlink/delete and meta data performance.
Write performance with fio #

Fio is an I/O testing tool that can spawn a number of threads or processes doing a particular type of I/O action as specified by the user, and report I/O performance in many useful ways. Our focus is on throughput and latency.
Our goal here is to measure sequential write performance. I’m going to assume block size to be 128 KiB as ZFS default record size is 128K.
Test setup: #
Install fio as per instructions on its website. Prepare a job file - write_test.fio that we can customise for several tests.
root@delorean:/sec_stor/backup/fiotest/fio-master # nano write_test.fio
; seq_write test
[global]
rw=write
kb_base=1024
bs=128k
size=2m
runtime=180
iodepth=1
directory=/sec_stor/backup/fiotest/
numjobs=1
buffer_compress_percentage=100
refill_buffers
buffer_compress_chunk=131072
buffer_pattern=0xdeadbeef
end_fsync=true
group_reporting

[test1]
Where,
kb_base instructs fio to use the binary prefix system instead of the decimal base(Kibibytes(1024 bytes) instead of kilobytes(1000 bytes)).
bs is blocksize and is set to 128 KiB.
size is file size and is set to 2 MiB.
iodepth - we’re running on FreeBSD. AFAIK, default ioengine is psync, and iodepth defaults to 1.
directory specifies where test files are created.
numjobs is our tunable for unit of work. Example, 10 will instruct Fio to spawn 10 processes each independently working on it’s own file of size - file size specified earlier.
numjobs is the number of processes that FIO spawns to generate IO. Each of the spawned process will create a file of size specified earlier, and generate IO to that file independent of other processes.
buffer_compress_percentage is the knob that controls the compressibility of the generated data.
refill_buffers instructs FIO to refill the buffer with random data on every submit instead of re-using the buffer contents.
buffer_compress_chunk is simply the size of the compressible pattern. I chose to match it with ZFS record legth which is 128K or 131072 bytes.
buffer_pattern is the pattern to use for compressible data. Needs to be specified to prevent FIO default of using zeroes.
end_fsync instructs FIO to fsync the file contents when a write stage has completed.
group_reporting is to aggregate results of all processes.
Lets run it once to see if it generates 100% compressible data…
root@delorean:/sec_stor/backup/fiotest/fio-master # rm -rf ../test1.* ; sleep 1 ; ./fio write_test.fio
test1: (g=0): rw=write, bs=(R) 128KiB-128KiB, (W) 128KiB-128KiB, (T) 128KiB-128KiB, ioengine=psync, iodepth=1
fio-3.8
Starting 1 process
test1: Laying out IO file (1 file / 2MiB)

test1: (groupid=0, jobs=1): err= 0: pid=86394: Sun Jul 29 00:07:47 2018
  write: IOPS=8000, BW=1000MiB/s (1049MB/s)(2048KiB/2msec)
    clat (usec): min=68, max=122, avg=74.98, stdev=13.10
     lat (usec): min=68, max=123, avg=75.20, stdev=13.28
    clat percentiles (usec):
     |  1.00th=[   69],  5.00th=[   69], 10.00th=[   69], 20.00th=[   71],
     | 30.00th=[   71], 40.00th=[   71], 50.00th=[   72], 60.00th=[   72],
     | 70.00th=[   73], 80.00th=[   76], 90.00th=[   84], 95.00th=[  123],
     | 99.00th=[  123], 99.50th=[  123], 99.90th=[  123], 99.95th=[  123],
     | 99.99th=[  123]
  lat (usec)   : 100=93.75%, 250=6.25%
  cpu          : usr=200.00%, sys=0.00%, ctx=0, majf=0, minf=0
  IO depths    : 1=100.0%, 2=0.0%, 4=0.0%, 8=0.0%, 16=0.0%, 32=0.0%, >=64=0.0%
     submit    : 0=0.0%, 4=100.0%, 8=0.0%, 16=0.0%, 32=0.0%, 64=0.0%, >=64=0.0%
     complete  : 0=0.0%, 4=100.0%, 8=0.0%, 16=0.0%, 32=0.0%, 64=0.0%, >=64=0.0%
     issued rwts: total=0,16,0,0 short=0,0,0,0 dropped=0,0,0,0
     latency   : target=0, window=0, percentile=100.00%, depth=1

Run status group 0 (all jobs):
  WRITE: bw=1000MiB/s (1049MB/s), 1000MiB/s-1000MiB/s (1049MB/s-1049MB/s), io=2048KiB (2097kB), run=2-2msec
Where,
clat is completion latency, and we can see this test saw min of 68 us and average of 74.98 us.
bw is throughput and this test achieved 1000MiB/s
However, this was just an example test to manually verify that everything works as intended. Lets view the file it created..
root@delorean:/sec_stor/backup/fiotest/fio-master # ls -alh ../test1.0.0
-rw-r--r--  1 root  wheel   2.0M Jul 29 00:07 ../test1.0.0
So, it did create a 2 MiB file as we expected.
Let’s see how much space this file actually uses in the disk…
root@delorean:/sec_stor/backup/fiotest/fio-master # du -sh ../test1.0.0
165K  ../test1.0.0
Nice. Our ZFS system compressed this 2 MiB file down to 165 KiB because it was generated with 100% compressibility setting.
Let’s peek into the file to see what content was generated..
root@delorean:/sec_stor/backup/fiotest/fio-master # hexdump -C ../test1.0.0 |less
00000000  de ad be ef de ad be ef  de ad be ef de ad be ef  |................|
*
00200000
(END)
It’s our requested pattern in the entire file because we asked for 100% compression. Let’s modify this test slightly to make it generate 0% compressible data..
Modifying the write_test.fio file with following changes,
buffer_compress_percentage=100
buffer_pattern=0xdeadbeef
to
buffer_compress_percentage=0
;buffer_pattern=0xdeadbeef ; this is commented out.
Repeat the run :
root@delorean:/sec_stor/backup/fiotest/fio-master # rm -rf ../test1.* ; sleep 1 ; ./fio write_test.fio
test1: (g=0): rw=write, bs=(R) 128KiB-128KiB, (W) 128KiB-128KiB, (T) 128KiB-128KiB, ioengine=psync, iodepth=1
fio-3.8
Starting 1 process
~ ~ ~ ~ ~ ~ ~ ~ Timmed for brevity.
check actual usage on disk,
root@delorean:/sec_stor/backup/fiotest/fio-master # du -sh ../test1.0.0
2.0M  ../test1.0.0
It is using all of 2 MiB because it was not compressible as we expected.
root@delorean:/sec_stor/backup/fiotest/fio-master # hexdump -C ../test1.0.0 | less
00000000  a8 71 09 48 d3 ad 5f c5  35 2e 2d b0 b5 51 5a 13  |.q.H.._.5.-..QZ.|
00000010  c6 25 eb 1e 20 72 c3 13  b8 64 fa 70 ce 5e 52 18  |.%.. r...d.p.^R.|
00000020  97 4c c3 9b 5c 13 ab 06  92 e9 2c ed 89 14 88 15  |.L..\.....,.....|
00000030  32 9d dc c8 fa 0b ea 1e  a6 93 82 0a 11 dd bd 05  |2...............|
00000040  74 52 7d d7 60 36 39 0a  4e aa b5 71 0d bb 42 1a  |tR}.`69.N..q..B.|
00000050  49 b5 0f d9 86 9e 63 12  a9 76 7d 00 49 07 c8 09  |I.....c..v}.I...|
~ ~ ~ ~ ~ ~ ~ ~ Timmed for brevity.
As expected, file is filled with random data which was not compressible.
Based on this setup, I set up a few tests by varying two parameters, compressibility and load(numfiles). Here is how my test matrix looks like..
| 0% compressibility | 50% compressibility | 100% compressibility | |
|---|---|---|---|
| 1 Proc (1 X 128 GiB) dataset size = 128 GiB | TBD | TBD | TBD |
| 2 Procs (2 X 128 GiB) dataset size = 256 GiB | TBD | TBD | TBD |
| 3 Proc (3 X 128 GiB) dataset size = 384 GiB | TBD | TBD | TBD |
| . . . . . . | TBD | TBD | TBD |
| 9 Proc (9 X 128 GiB) dataset size = 896 GiB | TBD | TBD | TBD |
Note: data set set size increases in steps of 128 GiB along with the number of processes.
Keep in mind that my test system has 768 GiB of memory. So I tailored my test in a way that my dataset gets bigger than the total amount of memory at some point during the test.

What we see here is an example of what we call the hockey stick curve in performance engineering & queueing theory. Assuming constant service time, and constant arrival times, the queueing delay and hence response time follows this hockey stick curve. Once throughput hits a ceiling, the response times/latencies shoot up dramatically. The above chart is not as dramatic as the hockey stick because we’re looking at averages of both throughput and latencies.
and finally, fully compressible data..
Looking at the data together,
| 0% compressibility | 50% compressibility | 100% compressibility | |
|---|---|---|---|
| 1 Proc (1 X 128 GiB) dataset size = 128 GiB | 1623 MiB/s @ 45 us | 1756 MiB/s @ 50 us | 2491 MiB/s @ 44 us |
| 2 Procs (2 X 128 GiB) dataset size = 256 GiB | 2597 MiB/s @ 61 us | 2623 MiB/s @ 70 us | 4606 MiB/s @ 47 us |
| 3 Proc (3 X 128 GiB) dataset size = 384 GiB | 2954 MiB/s @ 90 us | 2050 MiB/s @ 153 us | 5950 MiB/s @ 55 us |
| 4 Proc (4 X 128 GiB) dataset size = 512 GiB | 2798 MiB/s @ 139 us | 2122 MiB/s @ 202 us | 6154 MiB/s @ 68 us |
| 5 Proc (5 X 128 GiB) dataset size = 640 GiB | 2528 MiB/s @ 206 us | 2388 MiB/s @ 247 us | 6548 MiB/s @ 85 us |
| 6 Proc (6 X 128 GiB) dataset size = 768 GiB | 2708 MiB/s @ 234 us | 2414 MiB/s @ 279 us | 6592 MiB/s @ 103 us |
| 7 Proc (7 X 128 GiB) dataset size = 896 GiB | 2625 MiB/s @ 292 us | 2210 MiB/s @ 364 us | 6510 MiB/s @ 122 us |
| 8 Proc (8 X 128 GiB) dataset size = 1024 GiB | 2565 MiB/s @ 350 us | 2295 MiB/s @ 401 us | 6278 MiB/s @ 145 us |
| 9 Proc (9 X 128 GiB) dataset size = 1152 GiB | 2674 MiB/s @ 379 us | 2332 MiB/s @ 447 us | 6348 MiB/s @ 168 us |
Out of curiosity, I took a look at the performance of the system while the IO test was in progress. Here are some pleasant sights I had.
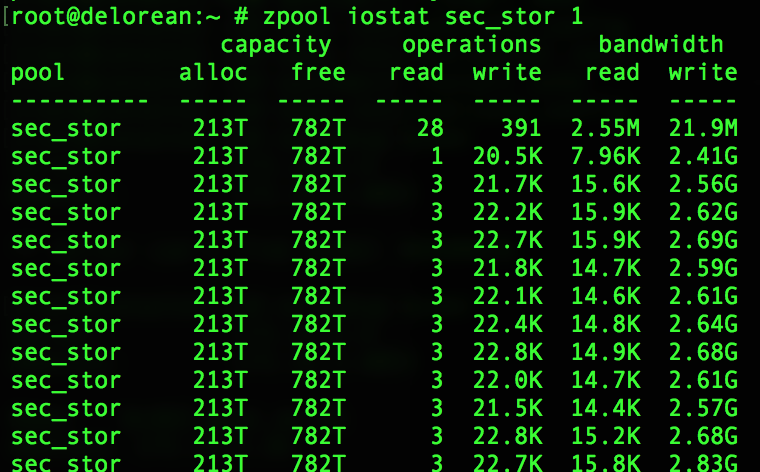
Overall disk bandwidth slightly less than 3 GB per second!
To put this in perspective, the network interface on this server is a 10Gbps link.
10Gbps = 1250 MB/s or 1192 MiB/s.
Our backup server is servicing writes faster than the 10 Gbps network it is connected to!
While this is happening, here is htop..
Good that the fio processes are not CPU bound.
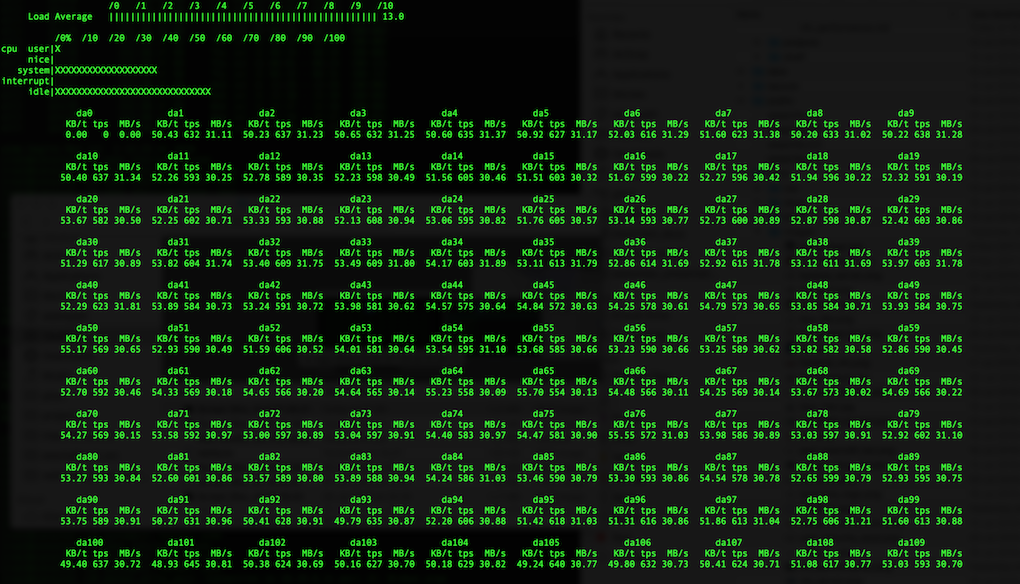
Here is another view of individual disk’s util through systat..

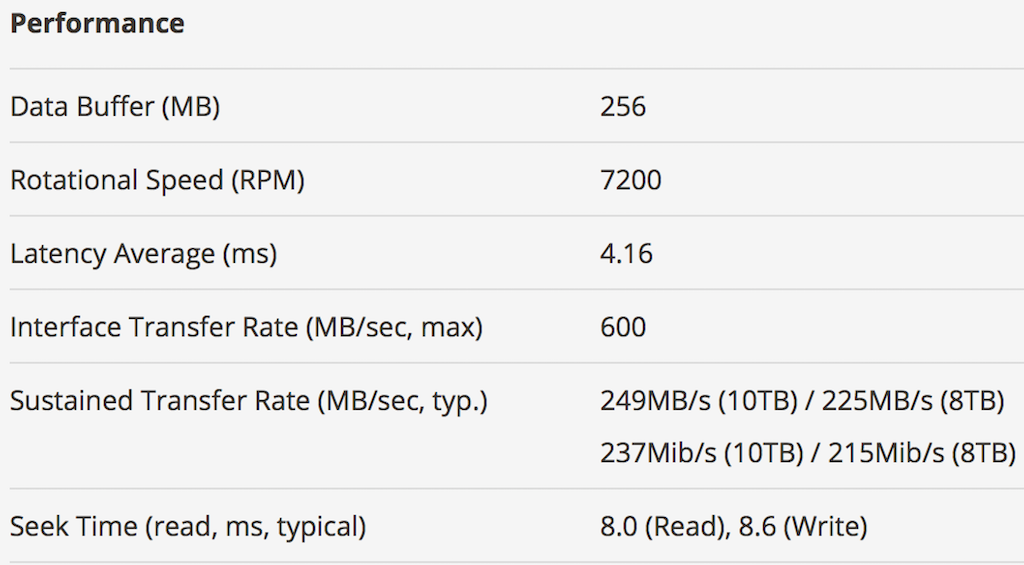
Ok, so each of these disks are doing approximately 30 MiB/s. However, the manufacturer rating of these disks are 237 MiB/s..

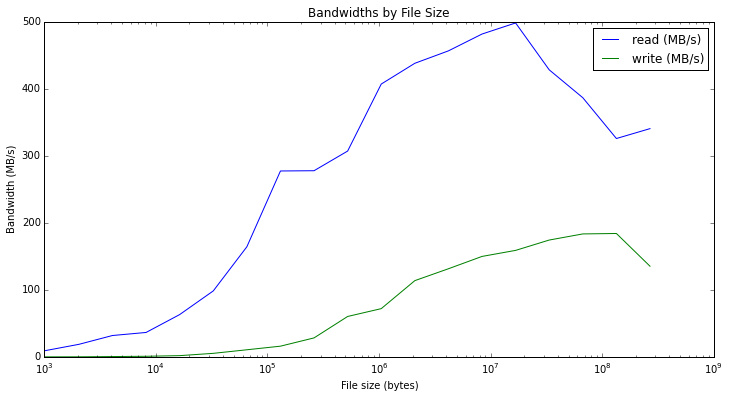
Deriving performance out of disks is more complicated than this. The manufacturer ratings dont apply for all conditions in which the IO hits the disks. IO sizes often play a big role in determining max throughput from a disk. Another factor is caching infront of the disks, and in the storage drivers. As an example of such wild swings, here is a snip from Matthew Rocklin’s research into disk throughput vs file size.

There may be opportunities to remove bottlenecks and further improve performance. But, that would be useless when the 10Gbps network is already a bottleneck.
Conclusion #
It was fun looking at the performance of the ZFS server in the context it will be used at. I’m amazed particularly by how ZFS handle compressible data with ease. At some point it should become the default. Knowing that the system I built exceeded performance goals is always good. Hopefully, these notes above helps others tailor their test cases to anlyze different scenarios.